Cro services in
CNS (Central Nervous System)
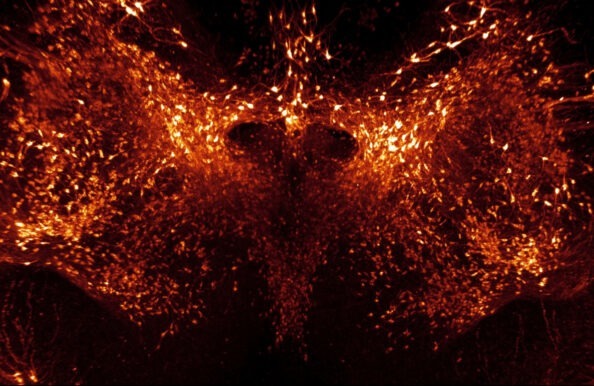
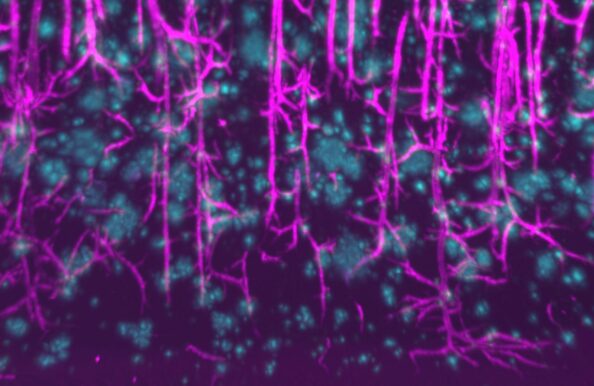
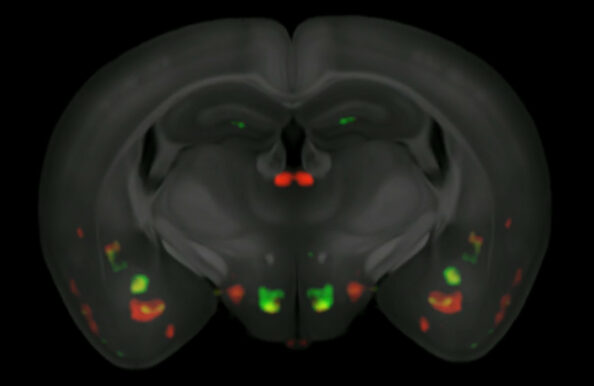
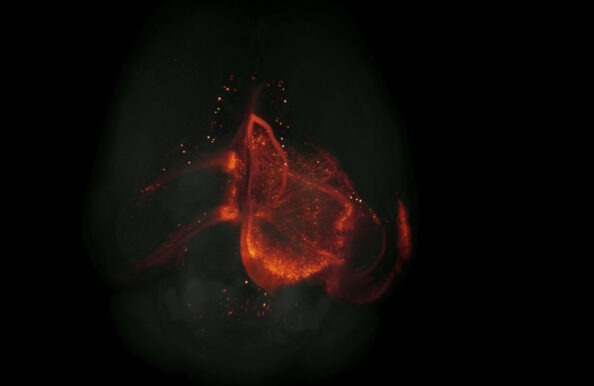
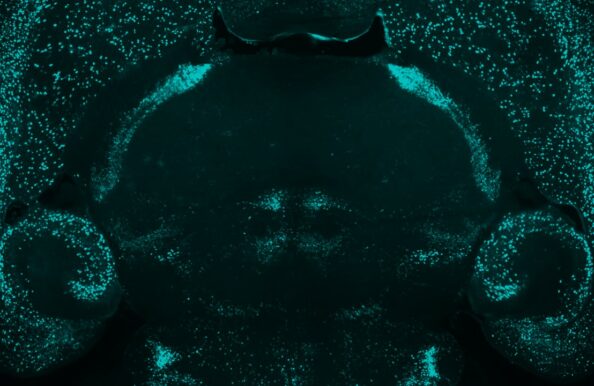
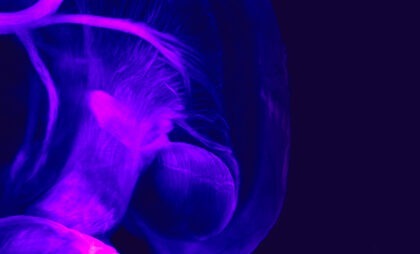
Gubra provides comprehensive solutions for preclinical CNS research using quantitative whole brain imaging. Whether you are working on a publication or a late-stage mode of action project, we can use our spatial biology approach to characterize neuronal activity (c-Fos), blood-brain-barrier (BBB) passage of your compound, or to visualize changes in gene expression and neurodegeneration (Alzheimer’s and Parkinson’s models). Using light-sheet fluorescent microscopy (LSFM) in combination with AI-assisted image analysis and our cloud-based brain browser, we deliver precise quantitative data of the entire brain directly to you.
Why Gubra?
- Experts in quantitative whole brain spatial biology and light-sheet microscopy
- Studies tailored to meet the requirements of publications or IND/NDA reports
- Quantitative data across all brain regions focusing on cell counts, plaque burden, or compound distribution
- Cloud-based interactive data viewer for investigating complex data sets
- Well-established pipelines to assess neuronal activity (c-Fos), drug distribution, rescue of neurodegenerative phenotypes, and gene expression


Consult with Senior Scientists
Allison Butt and Yasir Gallero-Salas
Discover how whole brain imaging can help you advance your drug development.
Spatial Biology Services for Quantifying Compound Effects and Distribution
Gubra is changing preclinical CNS drug discovery utilizing our 3D imaging platform. Explore how our whole-brain imaging pipeline can visualize drug distribution, map drug targets, and quantify treatment outcomes in unprecedented detail.
Main Offerings

Quantitative
whole brain imaging

Anatomical
reference mapping

Automated
stereotactic surgery

Complete
pharmacological solutions

Multiplexed
IHC & ISH endpoints

Gene
& cell therapy
Spatial Whole Brain Imaging to Actionable Data
Atlas-defined CNS imaging endpoints
Parkinson’s Disease
- Quantification of total dopaminergic neuron numbers
- Mapping and quantifying a-synuclein aggregate spreading
- Map markers of neuroinflammation and axonal architecture
- Monitoring progression of motor deficits
Alzheimer’s Disease
- Quantification of amyloid plaque burden
- Mapping cerebral amyloid angiopathy
- Visualization of drug distribution and BBB penetration
- Visualization and quantification of neuronal loss and brain atrophy
CNS activation
- Whole-brain activation (c-Fos) maps
- Voxel-based statistical maps for subanatomical responses to acute compound exposure
- Comparative c-Fos maps for benchmarking drugs
Drug distribution
- Visualization and mapping of drug distribution
- Identification and quantification of parenchyma vs vascular drug distribution
- Mapping and quantification of BBB penetrance
Gene therapy
- Distribution of AAV and non-viral gene delivery systems
- Validation and quantification of target knockdown/overexpression
Gene expression
- Whole-brain in situ hybridization for gene expression maps
- Quantification of drug target expression at single-nuclei resolution
- Delineating gene expression changes in disease models
Cloud-based data viewer
GubraView
Our cloud-based data viewer GubraView provides instant access to study data as it is uploaded, ensuring seamless monitoring throughout your study. With features for cross-group and cross-study comparisons, GubraView enables informed decision-making with statistical analyses. Accessible across multiple locations, GubraView empowers efficient and collaborative drug development for your whole team.


Related pages


For further information
Contact us
Gubra
Hørsholm Kongevej 11B
2970 Hørsholm
Denmark
+45 3152 2650